MiniProfiler for .NET (including ASP.NET & ASP.NET Core)
MiniProfiler for .NET now has a few flavors since .NET Core differs quite a bit from .NET Full Framework on the ASP.NET front. The pipelines have changed drastically (for the better), but that means how to configure MiniProfiler has also changed quite a bit.
- ASP.NET
- If you’re using ASP.NET (not .NET Core), start here.
- If you’re using ASP.NET Core, start here.
- Console .NET
- If you’re using .NET for a console application, start here.
- If you’re using .NET Core for a console application, start here.
Once you’re setup, see how to profile code to get some timings up and running.
About
MiniProfiler is a library and UI for profiling your application. By letting you see where your time is spent, which queries are run, and any other custom timings you want to add, MiniProfiler helps you debug issues and optimize performance.
The default setup is for every page to have an indicator so performance is always on your mind, like this:
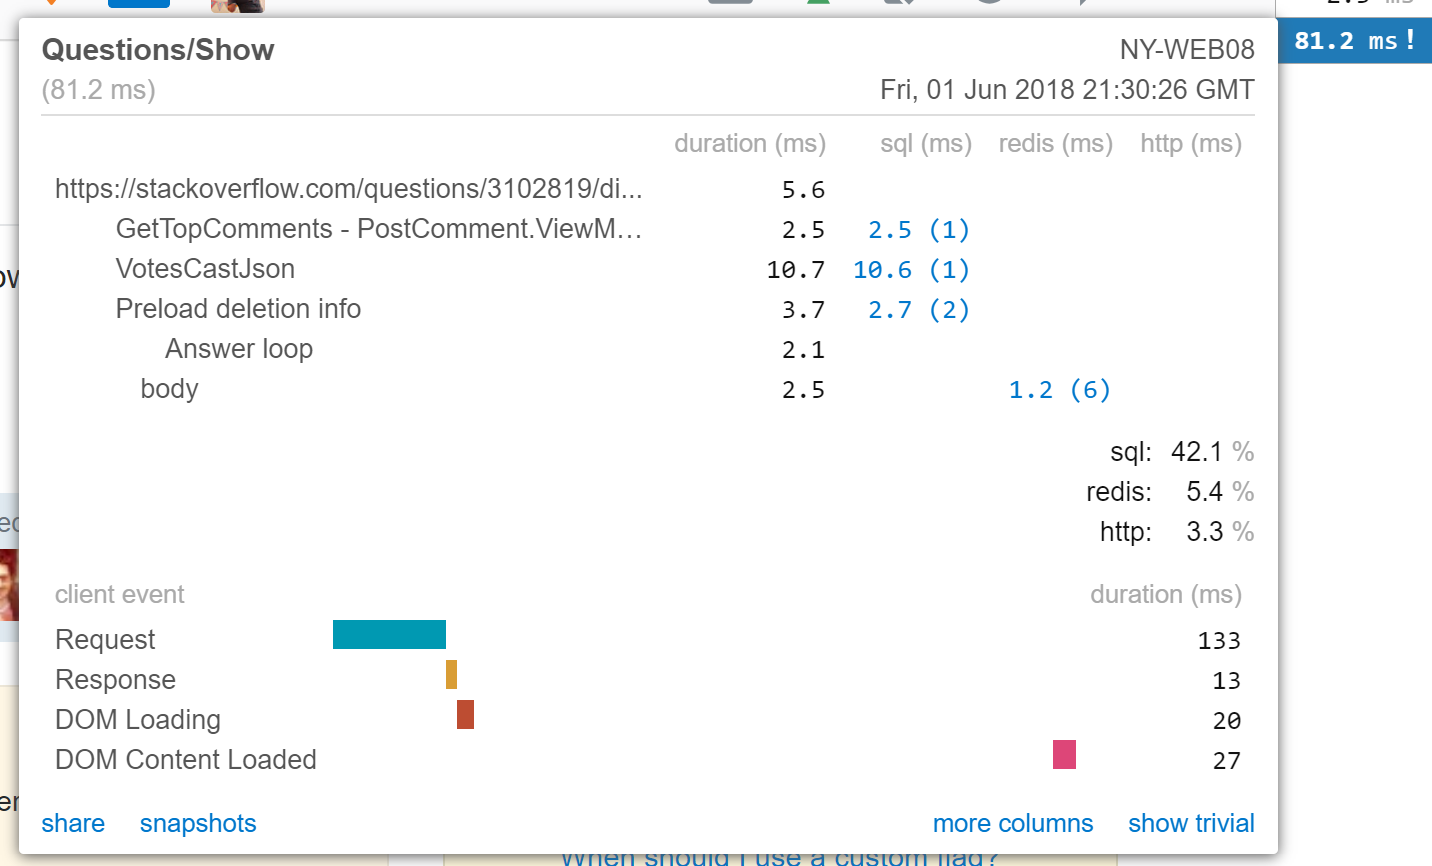
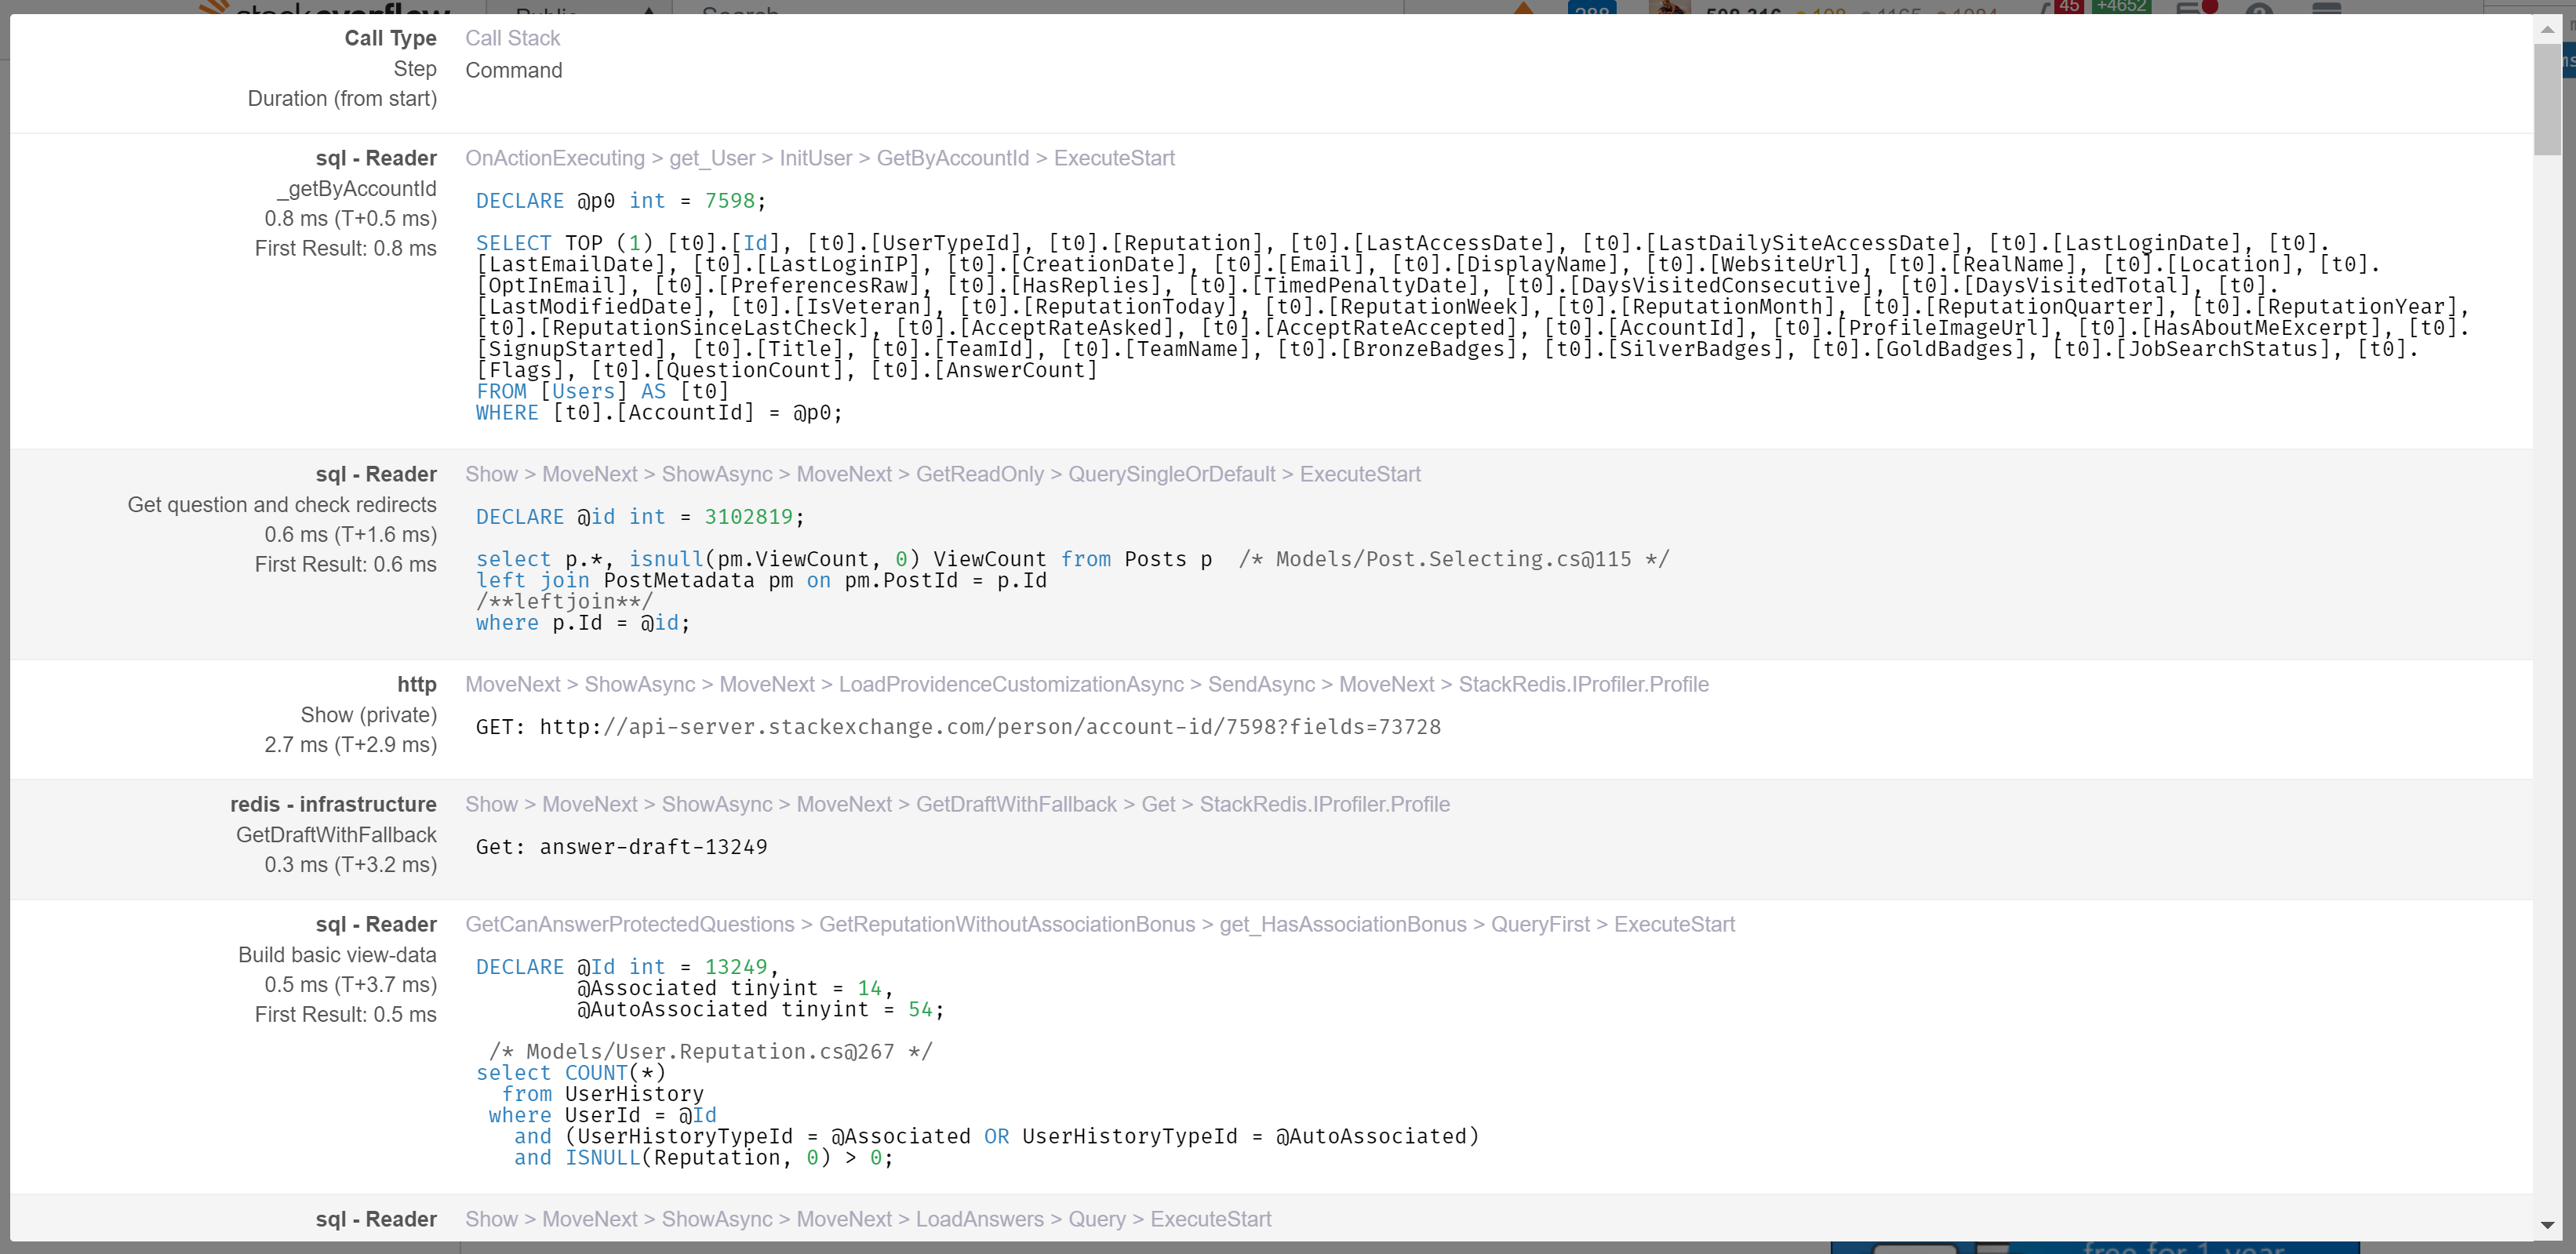
Note the share link for sharing timings with other team members. Any custom timings (like queries) can be expanded in detail as well:
Minimum requirements
MiniProfiler v4 runs on .NET 4.6.1 and above or .NET Standard 1.5 and above. .NET 4.6.1+ is required due to all of the async support added in v4. If you need to use a version earlier than .NET 4.6.1, MiniProfiler v3.x is for you.
White Listing
MiniProfiler exposes the following end points for profiling:
- /results-index
- /results-list
- /results
Links
- The MiniProfiler for .NET GitHub repo is located at MiniProfiler/dotnet.
- We accept pull requests here.
- Any issues can be reported in GitHub Issues or on the Community Site.
- Questions on Stack Overflow are welcome using the mvc-mini-profiler tag.
License
MiniProfiler is licensed under the MIT license.